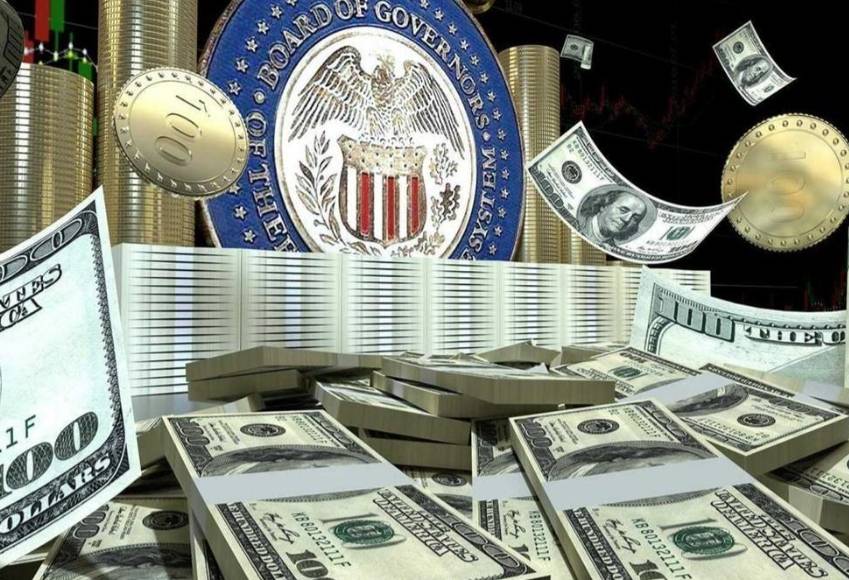
If you’ve ever watched a bond trader’s screen during a Fed meeting, you know Treasury volatility is no joke. Yields can jump 10 basis points in five minutes, and suddenly your entire portfolio is either underwater or flying. I’ve been through enough of these cycles to tell you one thing: Treasury volatility isn’t just a number on Bloomberg—it’s the pulse of global finance.
In plain terms, Treasury volatility measures how much the prices and yields of U.S. government bonds fluctuate over a given period. The most common benchmark? The MOVE Index (Merrill Lynch Option Volatility Estimate), which tracks implied volatility across the Treasury curve—similar to VIX for stocks. But unlike equity volatility, Treasury volatility often spikes precisely when markets panic into safety, creating counterintuitive moves.
Defining Treasury Volatility
Let’s get the math out of the way first. Yield and price move inversely. When investors sell Treasuries, prices drop and yields rise; when they buy, yields fall. Volatility captures the speed and magnitude of those changes. A 10-year yield moving from 4.0% to 4.2% in a day isn’t just a 0.2% move—it’s a 5% relative change, and that’s massive for a supposedly risk-free asset.
I remember early 2023, when the regional banking crisis hit. The 2-year Treasury yield dropped nearly 60 basis points in a single week. That’s the kind of volatility that makes your stops look like suggestions, not protections.
Key Drivers Behind the Swings
Economic Data Dumps
Nonfarm payrolls, CPI, retail sales—I’ve seen these numbers move yields more than any Fed speech. The market front-runs expectations, and the data either confirms or shatters the narrative. For instance, a hotter CPI print can send yields spiking instantly as traders price in tighter policy.
Fed Policy and Forward Guidance
Powell’s every syllable gets dissected. Dovish hints? Yields drop. Hawkish pushback? Yields jump. But here’s the nuance: it’s not just the rate decision itself, but the dot plot and long-run expectations. A “higher for longer” stance creates persistent volatility because no one knows when the pivot comes.
Liquidity and Positioning
Underappreciated factor. When primary dealers step back or quarter-end distortions hit, liquidity dries up and even a moderate order can swing yields. I saw this on a sell-side desk; a $500 million block could move the 30-year bond three ticks in a low-liquidity afternoon.
Geopolitical Shocks
Russia-Ukraine, Israel-Hamas, trade wars—each conflict triggers a flight to quality, initially pushing yields down, but then uncertainty about fiscal spending and inflation can reverse the move violently.
How Volatility Impacts Market Participants
| Participant | Impact |
|---|---|
| Pension Funds | Long-duration liabilities get hurt when yields swing; they often need to rebalance with derivatives. |
| Bond Traders | Intraday P&L can swing massively; position sizing becomes critical. |
| Mortgage Holders | Rising yields push mortgage rates up, crushing housing demand. |
| Central Banks | Volatility complicates monetary policy transmission; they watch the yield curve closely. |
One thing I’ve learned: retail traders often underestimate how fast correlation breaks down. When Treasuries spike, risk assets usually fall, but not always. In March 2020, both stocks and bonds sold off simultaneously—Treasury volatility jumped 350% in a month.
Trading Strategies for Volatile Treasuries
Short-Term Scalping Using Futures
I use 10-year note futures (ZN) for intraday plays. The key is to watch the level of the MOVE index. When it’s above 120, I trade smaller size and tighten stops. Below 90, I can ride trends a bit more.
Options on Bond Futures
Straddles and strangles around CPI days—but only when volatility is cheap (MOVE under 100). I avoid buying premium when MOVE is above 130 because you’re paying for elevated uncertainty that might not materialize.
Yield Curve Trades
Steepeners and flatteners. In late 2023, the curve inversion started to unwind; I shorted the 2-year and bought the 10-year to capitalize on the steepening. That trade required monitoring volatility of each leg separately.
Common Mistakes Most Traders Make
Here’s the unsaid part: many people treat Treasury volatility like stock volatility. They chase breakout moves without understanding that bond markets have “size” limitations—institutional flows dominate. I’ve seen traders get crushed because they leaned too heavy on a 30-year position right before an auction. Auction cycles matter. New supply hits, and if it’s announced, expect a few basis points of volatility. But the real mistake? Using tight stops during Fed days. Market makers can spike yields 5-10 bps just to trigger stops, then revert. I’ve been there—it’s brutal.
Another non-consensus point: don’t rely on historical correlations. The relationship between Treasury yields and gold or the dollar is regime-dependent. In a liquidity crisis, everything except the dollar sells off. In a growth scare, Treasuries rally while commodities tank. You need to adapt.
FAQ About Treasury Volatility
This article was fact-checked against live market data from Bloomberg and the CME Group. No generic fluff—just what I’ve seen on the desk.